Client Scorecard
Features How It Works Pricing FAQ Blog Contact
Warehouse BridgeVisibility Tools
  • WBWarehouse Bridge The parent — family overview→
  • DSDockSnap Dock photo documentation→
  • WHWarehouse Heatmap Slotting & utilisation→
  • CSClient Scorecard HereQuote vs actuals, per client·
  • HWHardware PTL, put walls, put-away→
warehousebridge.com →
Get Started
Insights

From the Client Scorecard team

Notes on client profitability, quote-vs-actuals tracking, 3PL contract drift, and what your WMS actually can — and can't — tell you. Honest writing for warehouse operators and commercial directors.

A Client Scorecard page for a single client showing month-to-date revenue, today's snapshot of pending/in-progress/completed orders, and a 12-month stacked-bar revenue trend split by charge type.
2026-05-19

You priced what they said. You're stuck with what they do.

3PLs sign contracts in good faith. Then volumes drift, the pick mix changes, storage stretches, and nobody documents what was promised vs what happened. By renewal, it's a he-said-she-said. Here's the document that fixes it.

Steven Sharp
A service-code breakdown table for one 3PL client showing each charge code, charge type pill (Admin, Picking, Freight, Handling, Storage), amount, percentage of revenue, count, and average per item.
2026-05-18

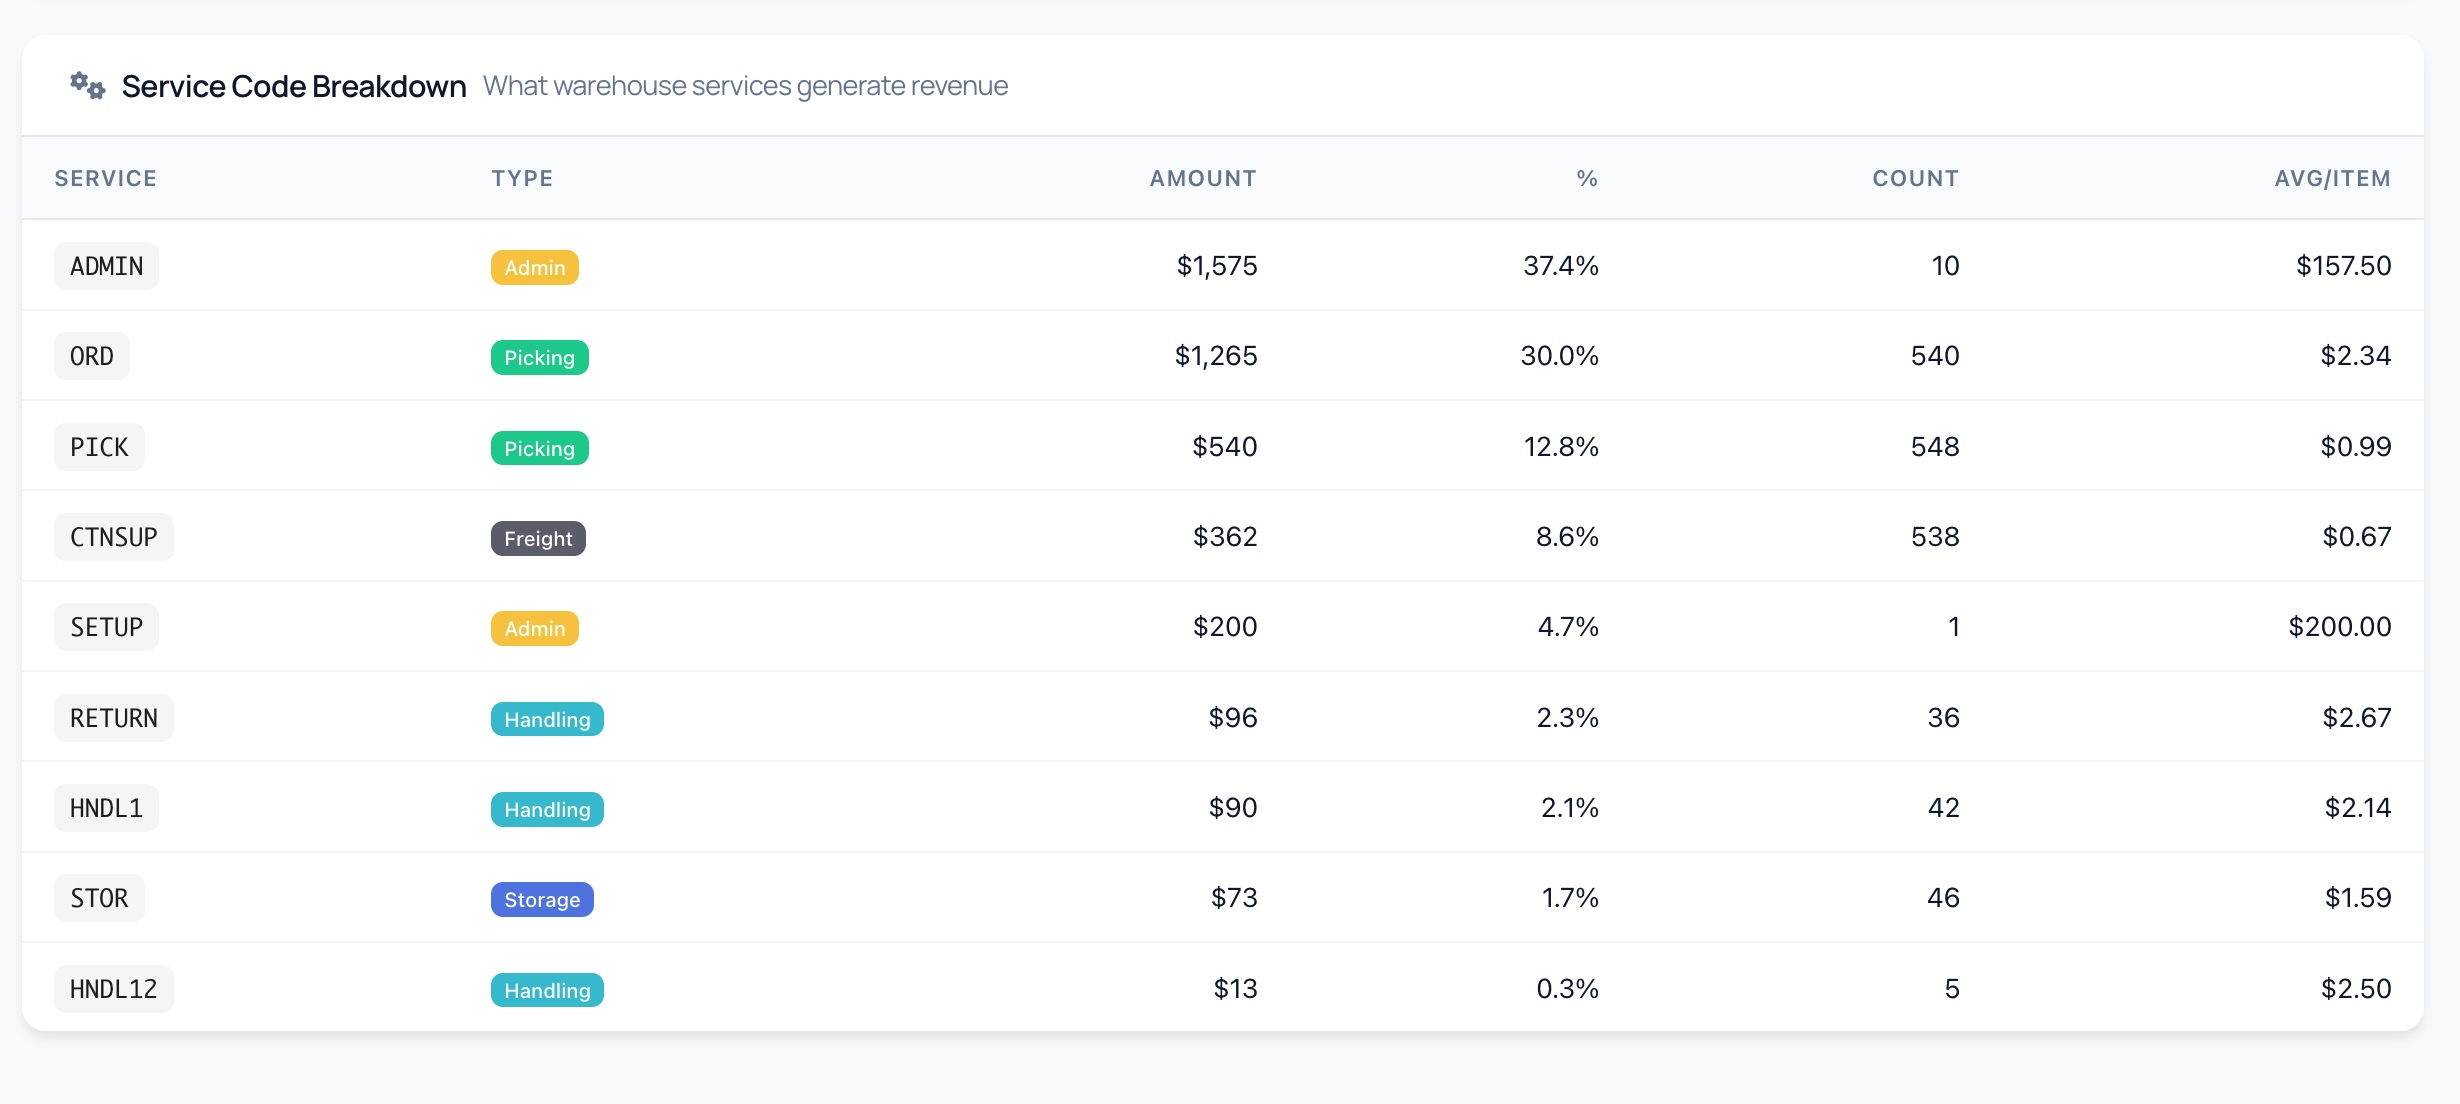
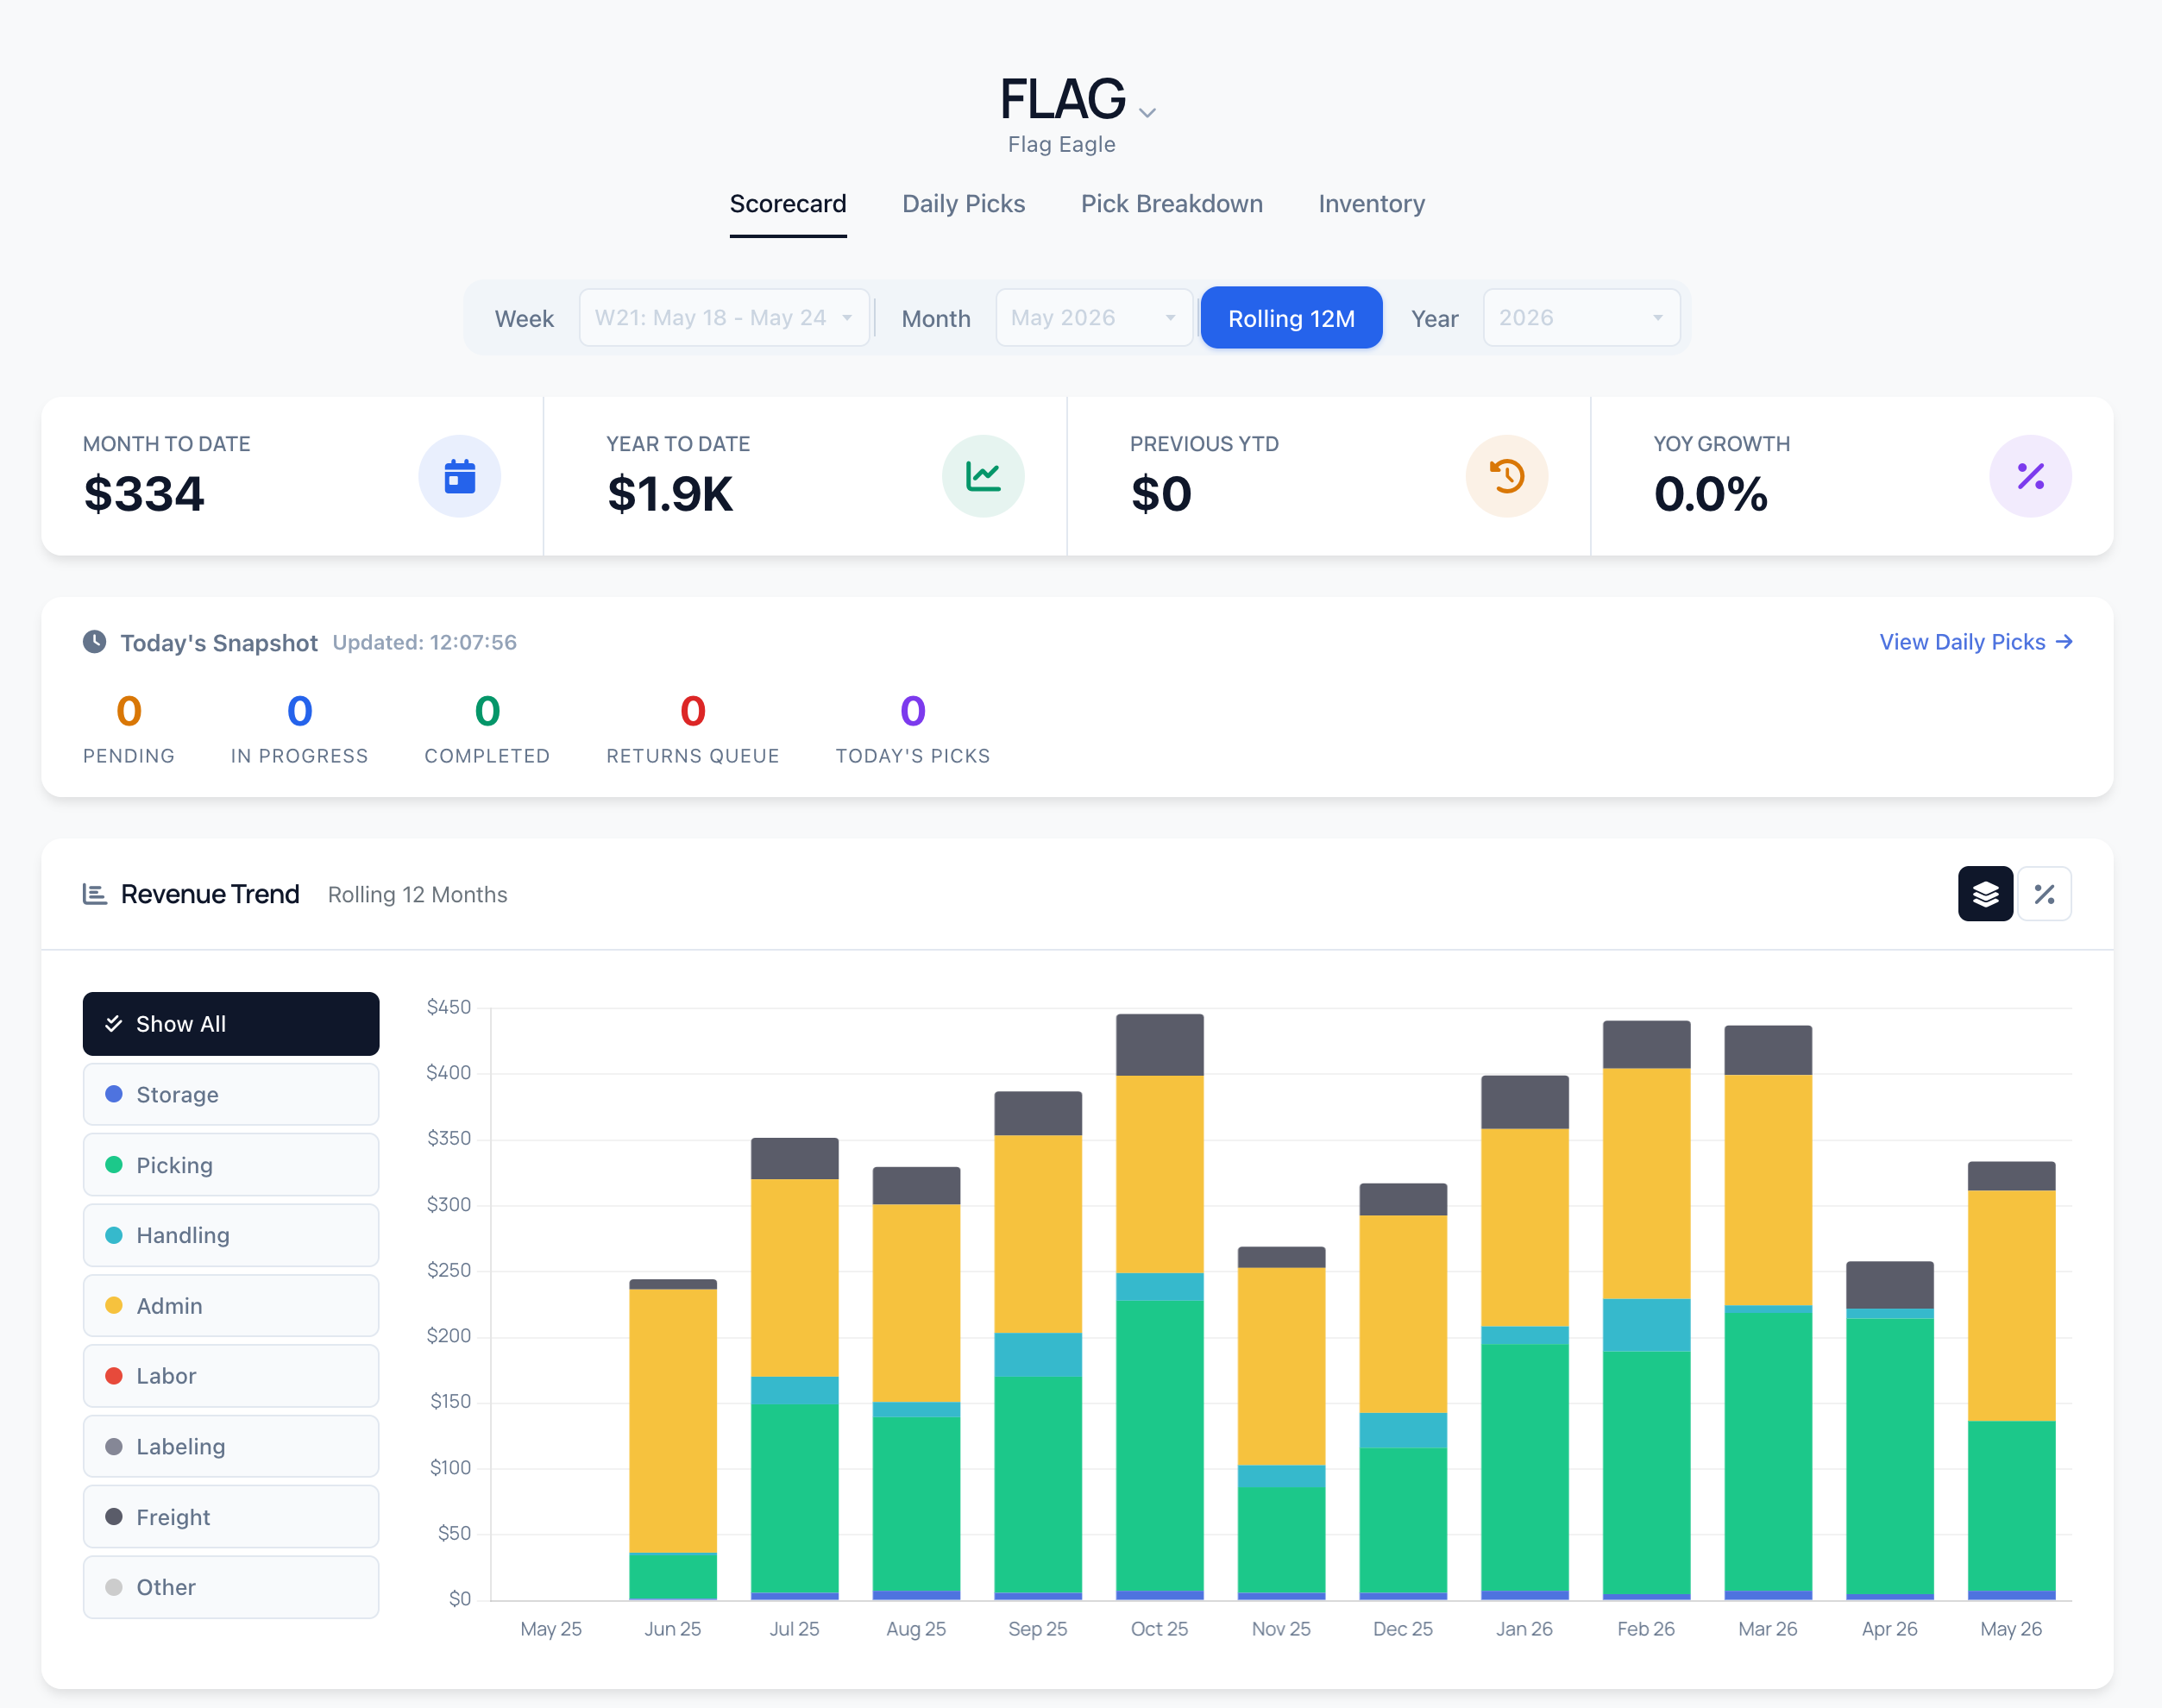
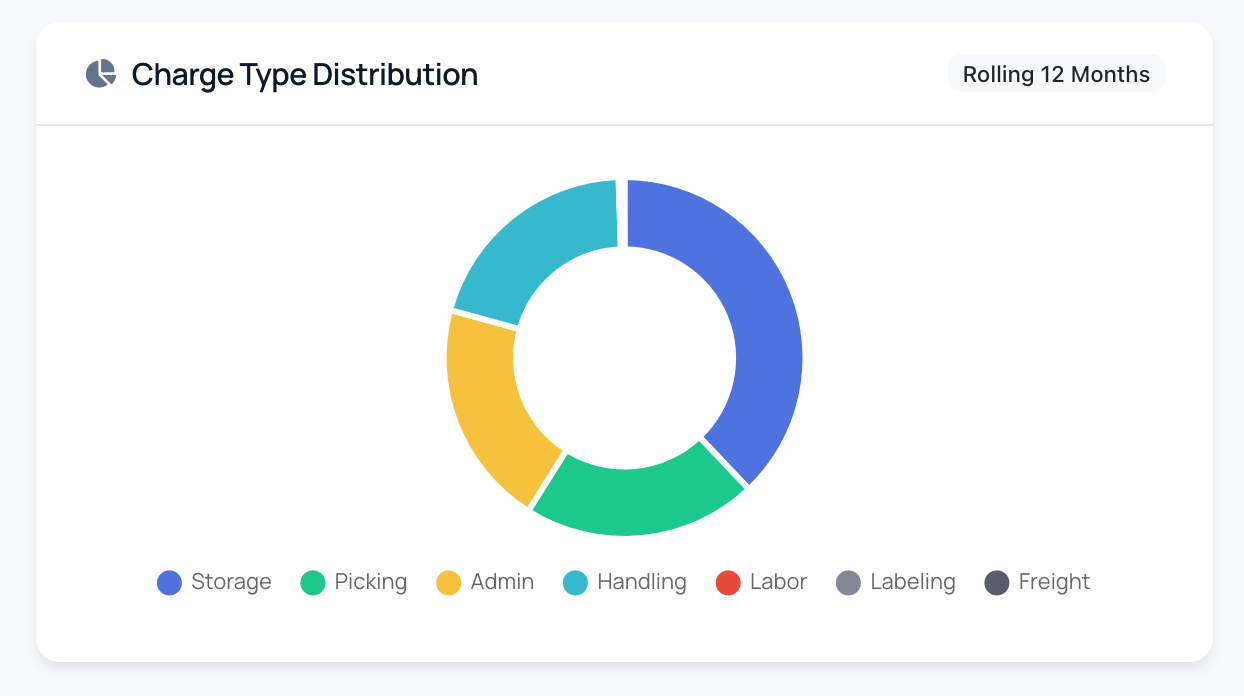
You bill them by the line. You grade them by gut feel.

3PL billing engines capture every storage pallet, every pick, every accessorial in granular detail. Almost none of that data flows back to the commercial team as an analytical view. Here's why — and what the operators who close the gap do differently.

Steven Sharp
A Charge Type Distribution donut chart for one 3PL client, broken into Storage, Picking, Admin, Handling, Labor, Labeling and Freight segments — visualising the share of total revenue each category contributes.
2026-05-17

Your top 10 clients by revenue aren't your top 10 by profit.

3PLs rank clients by revenue. They rarely compute true per-client profitability. The lists almost never overlap. Here's why — and the math that reveals which "top accounts" are actually loss leaders.

Steven Sharp
A 12-month Activity Trend line chart showing daily pick volume for a single 3PL client — 45,314 picks this period, 123.8 average per day, with month-by-month dots and clear seasonality.
2026-05-15

The industry KPIs your WMS can't actually calculate.

Every vendor blog publishes a "Top 9 KPIs" list. Most of them require timestamps your WMS doesn't capture, condition codes that aren't populated, and ASN reconciliation data that lives elsewhere. Here's an honest audit.

Steven Sharp
Client Scorecard

Client-level scorecard for 3PLs. Capture the activity profile a prospect promises at quote time, then grade reality against it. Built by a 3PL, for 3PLs — one page per client, ready for the renewal conversation.

Product

  • Features
  • How It Works
  • Pricing
  • FAQ
  • Get Started

Company

  • Blog
  • Contact
  • Part of the Warehouse Bridge family →

Contact

  • info@warehousebridge.com
  • Flag Eagle LLC
    401 Ryland Street STE-200
    Reno, NV 89502
  • 3plscorecard.com
Get Started
© 2026 Flag Eagle LLC. All rights reserved. Client Scorecard is a Warehouse Bridge product. Warehouse Bridge is a trading style of Flag Eagle LLC.
Privacy Policy Cookie Policy