You bill them by the line. You grade them by gut feel.
Walk into any 3PL's office and ask to see last month's billing. You'll get a clean, granular breakdown by client: storage pallets, receiving units, pick counts, accessorials, value-added services, returns. Every line tagged with a charge code. Every charge code tied to a rate card. The billing engine knows everything.
Ask the same operator which of their clients is most profitable. Watch the body language change.
This is the central paradox of 3PL operations: the data exists in extraordinary detail, and almost none of it makes it back to the people running the business as anything resembling an analytical view. Easy Metrics announced earlier this year that 40% of 3PLs struggled to grow profits despite the industry reaching $194B in revenue.1 GXO — the largest contract logistics player in the world — posted just 1.9% operating margin on $11.7 billion in revenue.2
The industry has the data. Most of the operators don't have the view.
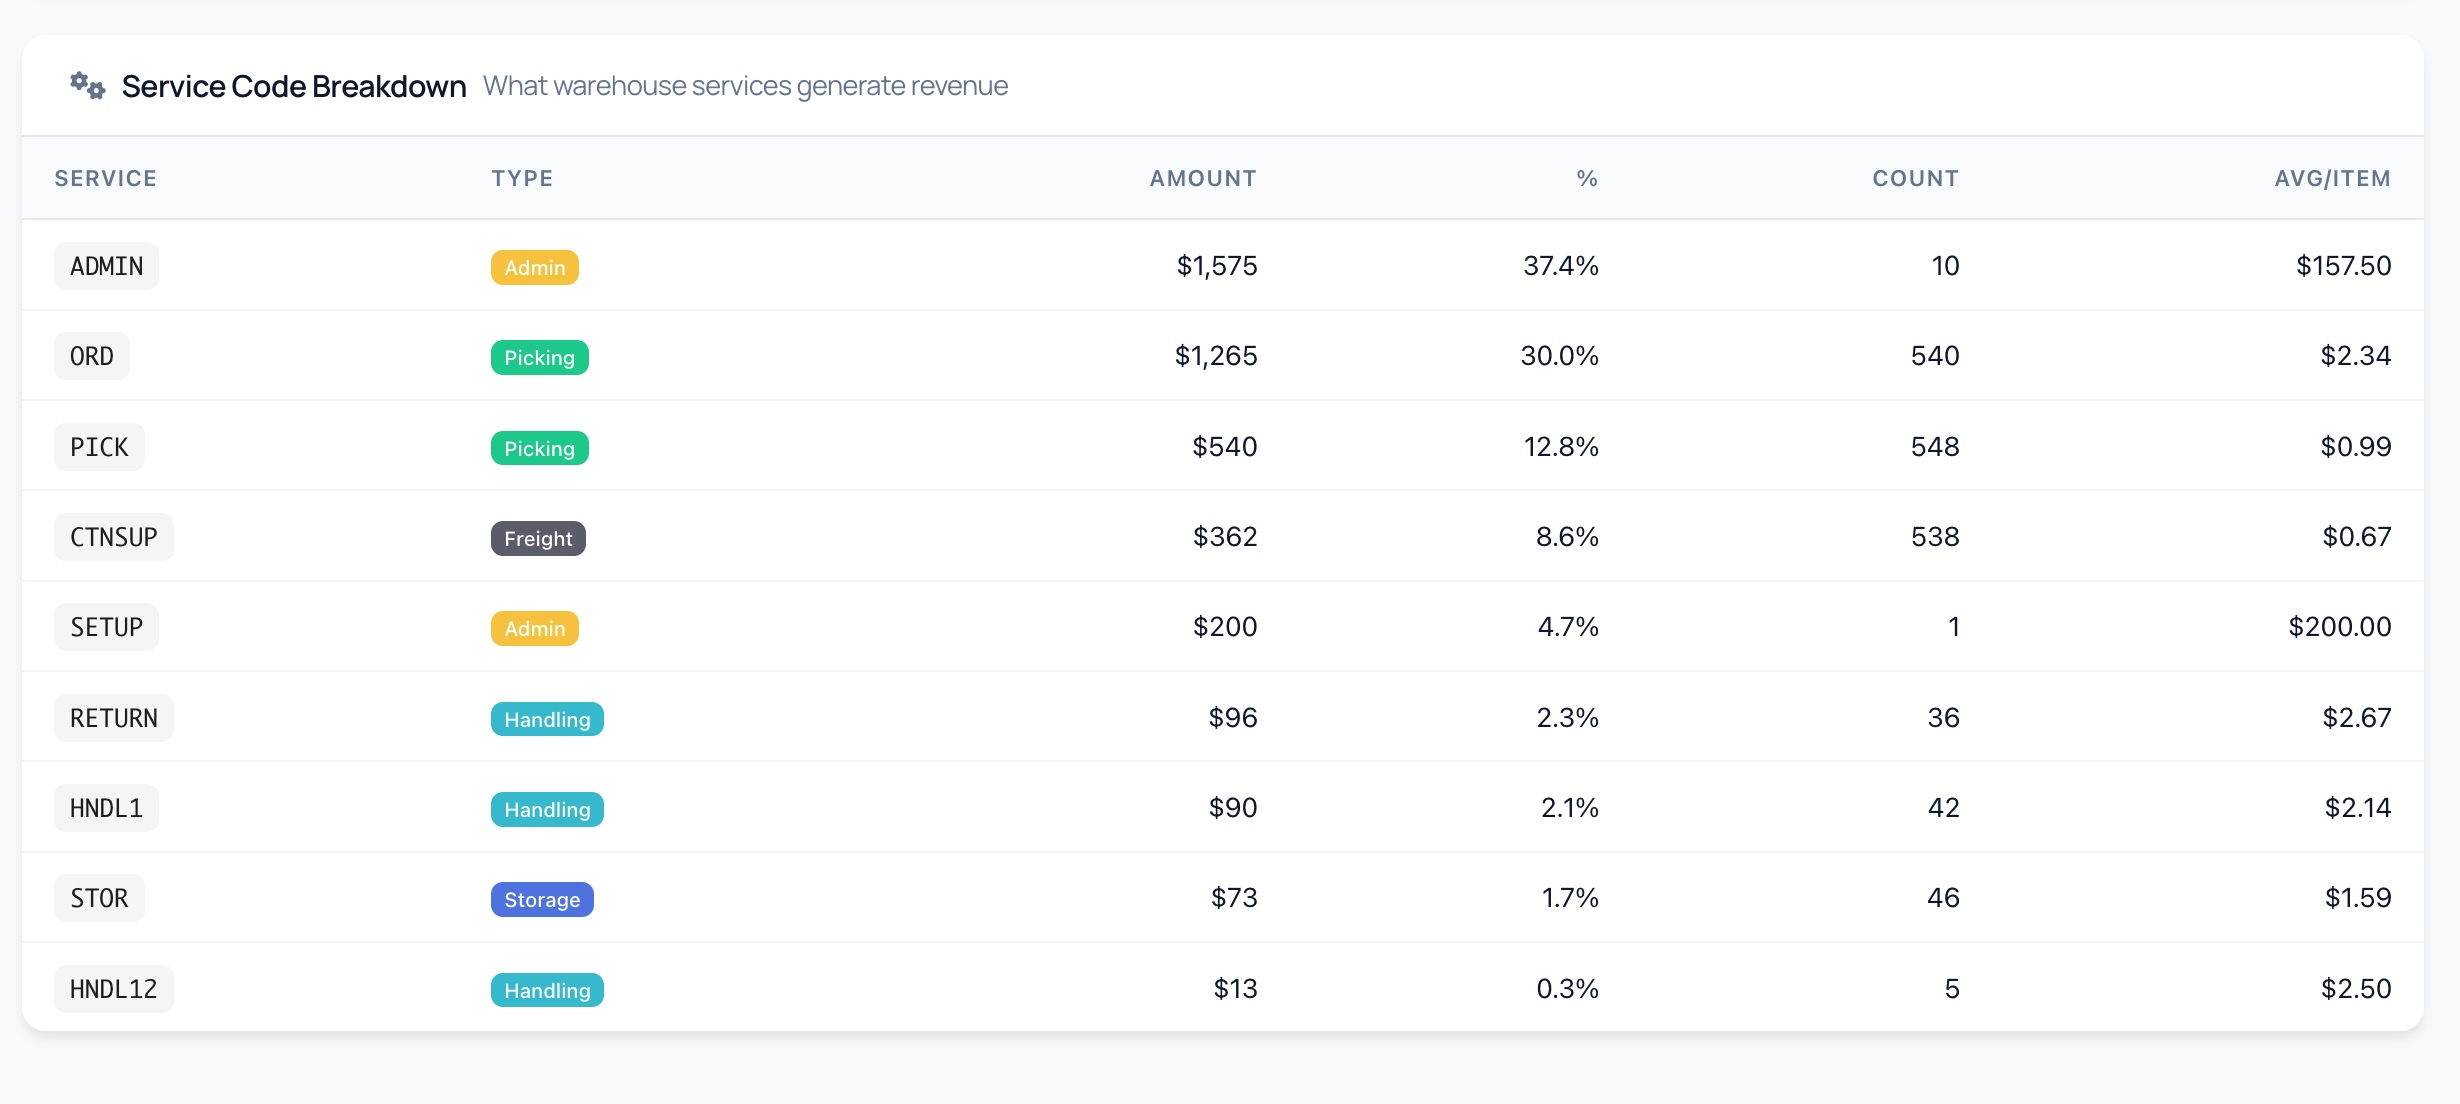
What the billing engine actually contains
Look at a typical 3PL rate card and you'll find something like this (consolidating Extensiv's pricing guide, the Fulfillment Advisor's 2025 warehousing market report, and the standard 3PL Center taxonomy):
- Storage — by pallet ($15–$40/month), by cubic foot ($0.55/cu ft), by square foot ($1.22/sq ft), by bin ($2.67/bin/month)
- Inbound — receiving fee per hour ($40.79/hr), per pallet ($12.91), per unit ($0.35)
- Outbound — base pick fee, additional pick fee, packing labor, dunnage materials
- Accessorials — labelling, stretch-wrap, blanket-wrap, air-bags, pallet supply, kitting
- Value-added services — light assembly, repacking, custom packaging
- Returns — typically $3–7 per unit, all-in
- Account management — fixed monthly retainer
Every one of those lines goes into your billing system every month. Multiply it by the number of clients you have, and you have hundreds or thousands of rows of granular cost-and-revenue data.3
So what's missing?
The data isn't organized into a per-client analytical view. The billing system was built to invoice clients, not to grade them. When the commercial director asks "which clients are storage-heavy versus pick-heavy?", they get a CSV export, hand it to an analyst, and get back a pivot table two days later. The next time the question gets asked, the analyst has quit, the formulas don't quite work, and the whole exercise starts over.
Datex put it this way:
Generic cost analysis based on averages tends to mask the high-cost-to-serve clients. Profitable accounts subsidize unprofitable ones, eroding overall margins.4
The cost of not knowing
Camelot 3PL Software estimates that 3PLs lose 5–15% of annual revenue to billable activities that aren't captured or invoiced — for a $2–6M warehouse, that's tens or hundreds of thousands of dollars left on the table.5
PackemWMS calculates that a typical mid-size 3PL leaks $30–80K annually purely from billing errors, underbilling, and missed accessorials.6 That's money that has already been earned — services rendered — but never billed.
The Journal of Commerce reports that one in four freight invoices contains an error, with billions of dollars in cumulative downstream cost.7 Meanwhile, more than half of 3PLs spend 16+ hours per month manually reconciling billing.8
That's the operational cost of the data gap. There's also a commercial cost.
When the commercial director walks into a renewal meeting without a per-client charge-mix view, they end up arguing about the rate card. The conversation goes: "Storage is going up." "Yes but we know we're paying too much for picking." Both sides argue about line items in isolation. Neither has the picture of how the mix has shifted for this specific client.
The 80/20 reality is much more useful than the rate-card argument. A client whose charge mix is 35% storage, 28% picking, 18% handling, 14% admin, 5% accessorials is a different renewal conversation than a client whose charge mix is 61% storage, 14% picking, 18% handling, 4% admin, 3% accessorials. The first is a balanced fulfilment account. The second is a shelf-hostage account whose business has quietly become a storage operation. The rate card is the same. The commercial conversation is fundamentally different.

The shelf-hostage anti-pattern
This is one of the patterns nobody publishes about — not because it's obscure, but because the people who would write about it (3PL operators) don't tend to publish, and the people who do publish (vendors, advisors) usually frame it from the brand's perspective ("manage your dead stock").
From the 3PL's perspective, the shelf-hostage account is simple: a client whose storage share of total spend has crept from 20–35% to 50–60% over the life of the contract. Each individual month, nothing dramatic happens. The client adds a new SKU. Velocity on some old SKUs softens. A handful of pallets that were supposed to move in Q3 are still there in Q1. By month nine, the warehouse is paying for shelf space the client isn't paying enough to occupy, and nobody flagged it because the revenue line still grew.
Saras Analytics framed the timing problem cleanly:
3PL and fulfillment expenses are billed weeks after orders ship, creating a 30-day blind spot that hides true profitability.9
Add to that 30-day lag a per-client charge-mix view that's only assembled once a quarter, and you have nine months of drift before anyone sees the picture.
What "seeing the picture" looks like
In our product, the charge-mix breakdown sits on the main scorecard for each client. The donut shows the proportion of revenue from each charge category. The 12-month trend shows whether the mix is shifting. Each charge code can be drilled into to see what's driving the change.
The point isn't that we invented charge categorization — Camelot's billing engine already does it, and so does every other major 3PL WMS. The point is that the categorization belongs on the commercial dashboard, not buried in the billing export. Every operator we've talked to has the data. None of them have it where the renewal conversation needs it.
The discipline that wins
Extensiv's benchmark data backs this up directly: high-profitability 3PLs were 187% more likely to spend fewer than 8 hours per month on billing.10 That's not "they have a magic billing tool." It's that the operators who automate billing visibility are the same operators who use the time saved to actually look at the data. Manual reconciliation is the proxy for "we don't really know what's happening."
So the operating recipe is straightforward:
- Get the charge mix per client out of the billing system and onto a dashboard.
- Make charge-mix part of every quarterly client review.
- When the mix shifts more than 10 percentage points away from the original quote, schedule a re-quote conversation.
That's the discipline. The data was always there.
If you'd like to see how the charge-mix breakdown looks for your own warehouse, see how it works or email us to talk about onboarding.
Sources
- Easy Metrics, "Easy Metrics Launches Profit Management Solution to Enhance 3PL Operating Margins up to 3%," press release via GlobeNewswire, January 2025.
- Speed Commerce, "How Do 3PLs Make Money? Inside Their Business Model," 2025.
- The Fulfillment Advisor, "2025 Warehousing Market Report," via Inbound Logistics.
- Datex Corporation, "3PL Cost Analysis," 2025.
- Camelot 3PL Software, "How Can 3PLs Eliminate Revenue Leakage and Transform Profitability."
- PackemWMS, "How to Eliminate 3PL Billing Errors That Cost You $30K–$80K Annually."
- Debales, "Freight Billing Errors and 3PL Costs," citing the Journal of Commerce.
- Ramco Systems, "Stop Revenue Loss from Manual Billing in 3PL Operations," 2024.
- Saras Analytics, "Hidden 3PL Fulfillment Costs."
- Extensiv, "Billing Best Practices for 3PL Warehouses," 2023.