The industry KPIs your WMS can't actually calculate.

Every vendor blog in the warehousing space publishes the same list. The headlines vary — "9 essential warehouse KPIs," "Top 30 warehouse KPIs to track in 2026," "the 38 most important warehouse metrics" — but the contents are almost identical.1, 2, 3, 4, 5
A 3PL ops director reading those lists comes away with a clean and confident impression: these are the things to track. The benchmarks are crisp. NetSuite tells you that on-time shipping below 93.4% is a "major improvement opportunity," that dock-to-stock should be under 24 hours and "best-in-class" is under 2 hours, that pick accuracy of 99.9% is the top-quartile bar.
Then the ops director goes back to their warehouse, opens their WMS, and tries to calculate any of those numbers.
This is the moment most 3PLs hit the wall.
The data dictionary doesn't match the KPI list
Last year I audited 1,000 sample records out of a production Camelot WMS — the underlying warehouse management system feeding a working 3PL operation. The goal was simple: can we calculate each of the nine industry-standard KPIs from the data the WMS actually captures?
The answer was mostly no. Here's what we found:
| Field | What we found |
|---|---|
activity_time |
00:00:00 for 100% of records |
condition_code |
empty for 100% of records |
inv_status |
empty for 100% of records |
activity_type |
"Pick" for 100% of records — no "Receive" or "Put" activities |
task_status |
"To Do" (926/1000) or "Registered" (74/1000) |
pw_receipt_date |
date only, no timestamp |
This is not a defect of one WMS. It's the structural reality of most mid-market WMS deployments. The schema has the fields. The fields aren't populated, because populating them would require the warehouse floor to capture timestamps and condition codes on every transaction, which is operationally expensive and almost never enforced.
Now look at the canonical 9-KPI list against that reality.
On-time shipments percent. Requires a "promised ship date" field and an "actual ship date" field. The WMS often has them — but in our sample, promisedDeliveryDate was 0001-01-01 (uninitialised) in all sample records. Calculable only if your clients populate the field. Most don't.
Total order cycle time. Order receipt to customer receipt. Requires carrier delivery confirmation data, which lives outside the WMS — in the eBay/Shopify/carrier API. Not calculable from the WMS alone.
Internal order cycle time. Pick-release timestamp to ship timestamp. Requires time-of-day precision. activity_time is 00:00:00. Calculable in days, not hours. Useless for the metric as defined.
Backorder percent. Requires a backorder flag or status. In our sample, no obvious backorder indicator existed on the order lines. Calculable only if the WMS has explicit backorder status, which most mid-market deployments don't enforce.
Dock-to-stock cycle time. Time from physical dock arrival to put-away completion. Requires dock timestamps (a separate yard/dock system, often not the WMS) and put-away timestamps. In our sample, Activity_Type was "Pick" for 100% of records — no Receive or Put activities captured. Not calculable.
Lines received and put-away per hour. Requires labour-hours per receiving worker per period. The WMS captures user_id but no shift start/end times. Calculable in lines per date, not per hour. Useless for an hourly productivity benchmark.
Percent of supplier orders received with correct documents. ASN accuracy. Lives in the EDI/inspection layer, not the WMS. The WMS receives a goods receipt; whether the ASN matched is a separate reconciliation that lives in a different system, if it lives anywhere. Not calculable from the WMS.
Percent of supplier orders received damage-free. Requires condition_code to be populated. In our sample: 100% empty. The field exists; the value is never written. Not calculable.
On-time receipts. Requires an "expected delivery date" on purchase orders. Sometimes present in purchaseDocuments, often empty. Calculable for some shipments, not for others. Partially calculable, but the denominator is small.
That's 0 out of 9 reliably calculable from the WMS we audited. Two are partially calculable (on-time ship, on-time receipt) if the input fields happen to be populated. The other seven are essentially fiction at most mid-market 3PLs.
The Perfect Order Fulfillment trap
The KPI most likely to be on a "must-track" list is also the most mathematically suspect. Perfect Order Fulfillment (POF) is defined as:
POF = (On-Time Rate) × (Order Completeness) × (Damage-Free Rate) × (Invoice Accuracy)
It's a multiplicative metric.6 The composite collapses to zero whenever any one component is uncaptured. If your damage-free rate isn't tracked — and we just saw that condition codes are typically empty — your POF either includes a fake number for damage-free, or it's mathematically zero.
Both options are dishonest. The first inflates the metric; the second collapses it. The realistic answer for most 3PLs is: don't report POF, because you can't compute it.
But POF is on every KPI list as a "composite health score" of the warehouse. Hopstack publishes a 38-KPI list with POF as the headliner.2 The vendors selling these KPI lists are the same vendors whose modules don't capture the data required to compute them honestly.
The vendor irony
Read enough of these lists and the pattern becomes clear: the WMS vendor publishes "30 KPIs you must track" because the article ranks well in search, generates leads, and positions them as the industry authority. The underlying product — the WMS itself — captures the structured fields the KPIs theoretically require but doesn't enforce the data entry that would make them real.
So the KPI list is a marketing artifact. The actual data dictionary is a different document, and rarely audited publicly.
Fluxicon — a process-mining consultancy that has done this work in dozens of organizations — frames the underlying problem more politely:
Timestamps can cause problems when they are not sufficiently different — for example, if only a date exists without time, it may be unclear in which order activities within the same case actually occur.7
That's the polite version. The blunt version is: most warehouse KPIs depend on event-level timestamping the typical mid-market WMS doesn't reliably capture. The KPIs were defined by an industry that imagined a richer data environment than the one most operators actually have.
PwC's data-quality survey found that 55% of companies struggle with poor data quality, with direct impact on operational efficiency.8 The "poor data quality" in this context is rarely about the amount of data — it's about the fields that should be populated but aren't.
What you can measure honestly
The honest reframe is: stop trying to compute the KPIs your data can't support. Instead, build your dashboard on the metrics your data does support reliably.
For most mid-market 3PLs on standard WMS deployments, that means:
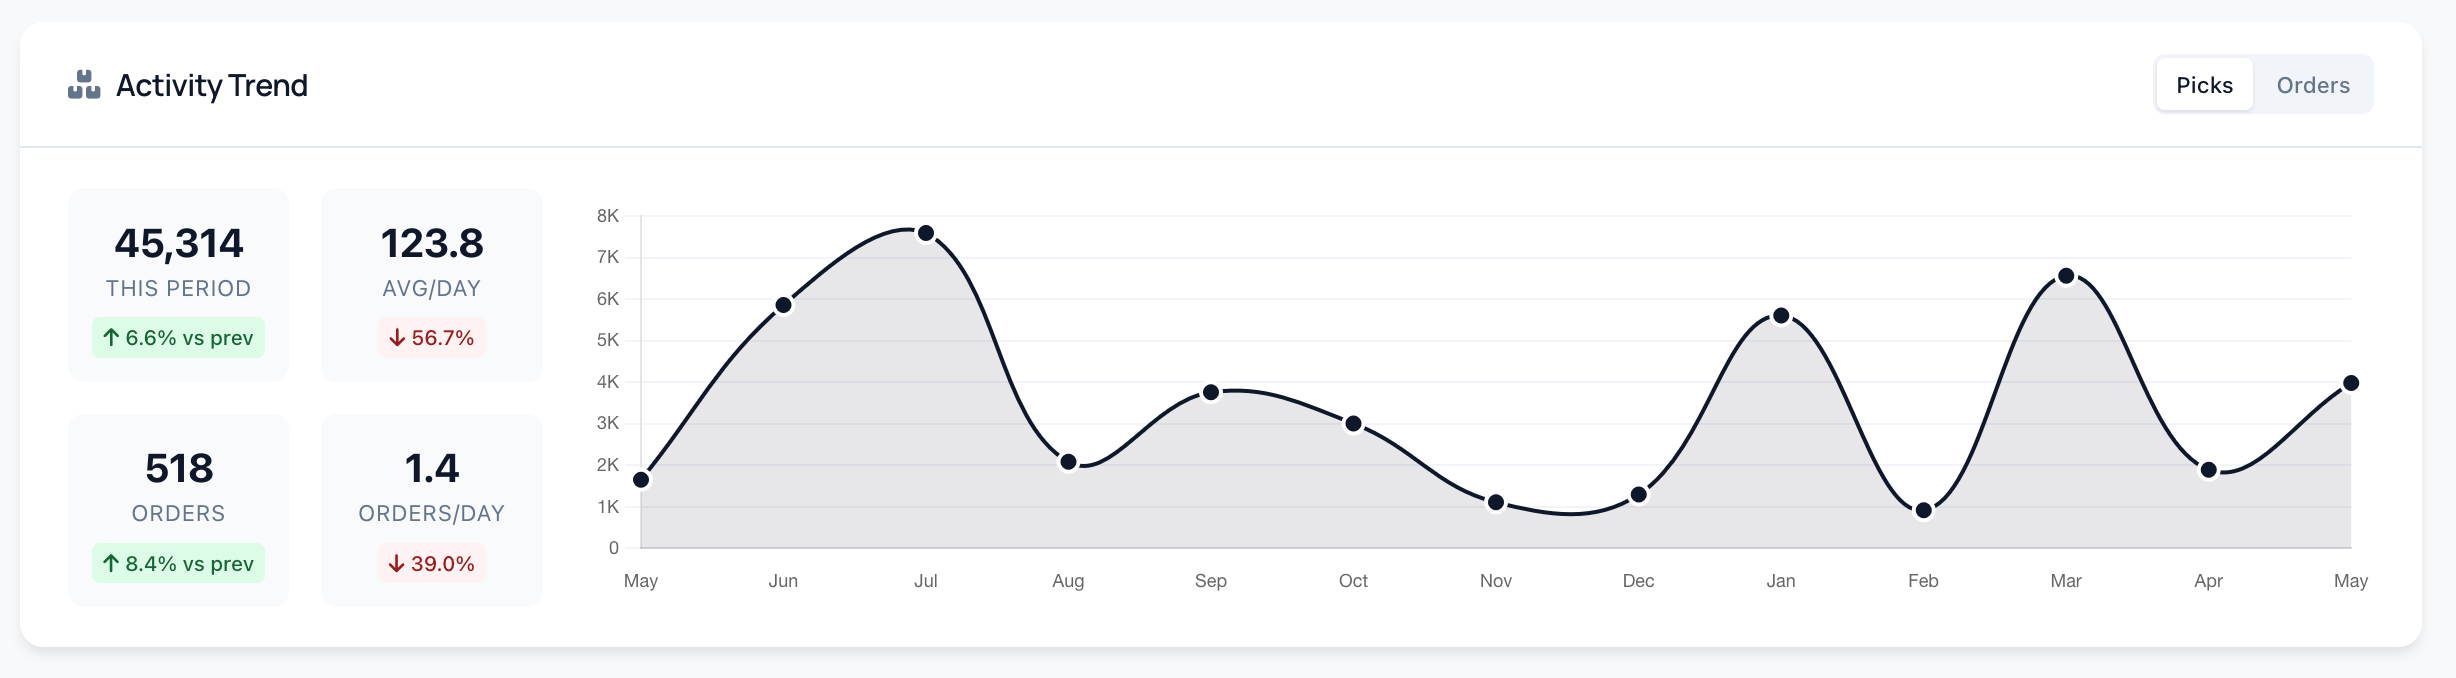
- Pick activity per client per day. The WMS captures pick records with date and client. Reliable.
- Revenue per client per month, broken down by charge type. The billing engine captures this in detail. Reliable.
- Inventory turn per client per quarter. Receipt dates and pick dates exist as dates. Date arithmetic works. Reliable.
- AR days outstanding per client. The customer ledger captures invoice dates and payment dates. Reliable.
- Bin count per client. The piece ledger captures bin assignments. Reliable.
- Charge-mix per client. Derived from billing lines and categorization rules. Reliable.
These will give you 80% of what you need to run a per-client commercial conversation. They're not the canonical "top 9." They're the ones you can actually compute.
There's a different KPI list waiting to be written — one that audits the canonical 9 against typical WMS schemas and labels each metric computable, partially computable, or fiction. The process-mining community has been writing about the timestamp problem for years, but the conversation hasn't crossed into the 3PL trade press. That's a real piece of public discourse waiting to happen.
What this means for the renewal conversation
If you can't compute POF, on-time delivery, dock-to-stock, lines per hour, ASN accuracy, or damage-free rate — and that's most mid-market 3PLs — then walking into a quarterly review with a deck full of those numbers means walking in with a deck full of fiction. The client knows it. The ops team knows it. The conversation defaults to soft topics because the hard topics aren't backed by real data.
The fix is to stop reporting what you can't reliably compute, and start reporting what you can. Activity trends, revenue per client by charge type, AR days, inventory turn, bin count, charge mix. These are the metrics a serious renewal conversation can be built on, and they're already in your data.
Hopstack's own list has one quote that contradicts the rest of the document:
The best operators don't track dozens of numbers. They focus on a small set of metrics that directly impact throughput, labor cost, accuracy, and customer lead times.2
It's right. The published lists ignore the advice. A small set of honest metrics will tell you more about your operation than a long list of vanity numbers. Build the dashboard on what your data actually says — not what someone else's blog tells you to measure.
If you'd like to see what your WMS can honestly compute, see how it works or email us about an onboarding session.
Sources
- Shipedge, "9 Essential Warehouse KPIs."
- Hopstack, "Warehouse Metrics and KPIs."
- Modula, "Warehouse KPIs."
- Logiwa, "Warehouse KPIs: Key Performance Indicators."
- NetSuite, "Logistics KPIs and Metrics."
- User Solutions, "Perfect Order Fulfillment KPI."
- Fluxicon, "Process Mining Book — Data Quality."
- TheCodeWork, "How to Overcome Common WMS Implementation Challenges," citing PwC.