Your top 10 clients by revenue aren't your top 10 by profit.
If you asked a 3PL GM to name their top five clients, you'd get an answer in seconds. The names that come up will be the names attached to the biggest invoices. Those are the revenue leaders.
If you asked the same GM to name their top five clients by profit, you'd usually get a much longer pause. Often you'd get the same five names — but with much less confidence about whether those are right. And sometimes you'd get a different list entirely.
That gap between confidence about revenue and confidence about profit is the central operational tension in modern 3PL. The industry's average net margin has compressed from 8.83% to 7.25% over recent years.1 GXO — the world's largest contract logistics player — runs at 1.9% operating margin on $11.7 billion of revenue.2 At that level of margin, one mispriced large account wipes out the surplus from several smaller correctly-priced ones. Top-line growth is actively dangerous in the absence of per-client P&L.
And the data says most operators don't have per-client P&L.
The growth trap
Extensiv's 4th Annual Benchmark Report surveyed 240+ operators and found something striking: 3PLs growing primarily through new customer acquisition were 61% more likely to report low profitability (36%) than those who expanded existing-customer share (22%).3
That's a counter-intuitive number. The industry narrative is "we're growing — we're winning new clients." The Extensiv data says: the operators who win new clients faster are more likely to be in profitability trouble, not less. Because every new client signed at a rate card based on assumptions, without per-client P&L visibility, is another contract that can quietly drift into loss. Adding more of those doesn't compound your margin — it dilutes it.
The other Extensiv finding is even sharper. High-profitability 3PLs were 187% more likely to spend fewer than 8 hours per month on billing. The disciplined-billing operators win. The operators who automate billing visibility free up the analyst hours to actually look at the per-client picture — and the per-client picture is where the difference between revenue rank and profit rank shows up.
The Storage Annuity Illusion
The biggest single reason your top-revenue client may not be your top-profit client is something I think of as the Storage Annuity Illusion.
Pallet storage in North America runs $15–$40 per pallet per month.2 Once a client has 200 pallets on your shelves, that's $3,000–$8,000 of monthly recurring revenue at almost no marginal effort. It feels like an annuity. The pallets are there, the storage revenue arrives every month, and the client never complains about that line on their invoice.
Then the client grows. Picks per month go up. Order complexity grows. New SKUs arrive. Labor consumption per dollar of storage revenue starts climbing. Nobody re-prices the contract because the revenue line still looks healthy. But by month twelve, the gross margin per pallet has quietly inverted: you're paying more in pick labour, dock time, and storage utilization than the pallet revenue is bringing in.
The revenue keeps growing. The profit doesn't. And because the revenue line drives the GM's perception of which clients are "good," the inverted account stays in the top-5 list it shouldn't be in.
Datex put this exact pattern bluntly:
Neglecting to perform adequate warehouse costing inevitably results in obscured client profitability when seemingly good accounts are actually loss leaders due to hidden costs. Generic cost analysis based on averages tends to mask the high-cost-to-serve clients.4
Advantive made the same point in slightly different terms:
A client with complex, labor-intensive needs can be unprofitable even if they pay high storage fees. Without this analysis, a 3PL risks having its profitable accounts subsidize its unprofitable ones.5
The math that surfaces it
There's a useful exercise from Datex worth walking through. Imagine your picking activity for a month consumes $50,000 of total cost — labour, equipment, supervision, the share of overhead allocated to picking. Now divide by total line items picked across all clients. If you picked 100,000 line items, your cost-per-line is $0.50.
Now look at Client A: 10,000 lines picked. Picking cost allocated to Client A: $5,000.
Client A's invoice shows storage at $4,500, picking at $2,500, handling at $800, accessorials at $300. Total revenue: $8,100. Picking margin alone: $2,500 revenue against $5,000 cost. The picking line on Client A's invoice is negative gross margin before you even look at the other categories.
Most 3PLs never do this decomposition. Because the revenue line for Client A says $8,100, and that's a respectable number, the account gets credited as "profitable." Datex's framing is: seemingly good accounts are loss leaders due to hidden costs.
The math takes minutes once the data is structured. But the data is almost never structured this way.

Inventory carrying cost as the hidden line
There's another hidden cost that almost never appears on the per-client view: inventory carrying cost. Netstock's benchmark data puts inventory carrying costs at 12–16% of total supply-chain spend, and 20–30% of inventory value annually.6
For a 3PL, "inventory carrying cost" includes shelf opportunity cost, insurance, taxes on stored value, and — most importantly — the lost revenue from not being able to put a higher-velocity client's pallets in the same space.
If 20% of a client's stock hasn't moved in 90 days (Netstock's benchmark for slow movers is inventory turn <4–6/year, or DSI >60–90 days), that 20% is consuming shelf you could have sold to a faster account. The carrying cost is real even though it doesn't appear on any invoice line.
NetSuite reports that the retail industry alone carries roughly $50 billion in dead inventory annually, and that 20–30% of inventory in even well-run companies is dead stock.7 Most 3PLs are storing some portion of that for their clients. Some are charging enough storage to cover the carrying cost. Most aren't.
The 80/20 question that matters
Pareto's pattern shows up in 3PLs the way it does everywhere else: ~20% of customers drive ~80% of revenue.8 That's usually treated as a comfort: the top of the list keeps the business alive.
The harder question is: do your top 20% of clients by profit overlap your top 20% of clients by revenue?
If they overlap fully, you're running a disciplined operation. The revenue concentration matches the profit concentration; the high-revenue clients are correctly priced for the work they consume.
If they overlap partially — say 6 out of 10 names appear on both lists — you have two distinct customer cohorts that need different treatment. The 4 names that appear on the revenue list but not the profit list are the ones whose contracts need re-quoting at renewal. The 4 names that appear on the profit list but not the revenue list are the ones you should be working to grow.
If they don't overlap at all, you have a structural pricing problem. The clients funding the business are not the same clients winning the rate cards. That's not an operations problem — it's a commercial problem, and it needs the commercial director to act on it, not the ops team.
The only way to even start that conversation is to be able to print the two lists side by side. Which means having a per-client P&L view in the first place.
What gets measured gets re-priced
The trade press keeps publishing "calculate per-client profitability" advice. Datex, Advantive, Extensiv, Veracore — all of them say it. None of them publishes data on how many 3PLs actually do it. We suspect the number is small, but it's an honest open data gap. If you've measured it for your own operation, you're already ahead of most of the industry.
The discipline isn't complicated:
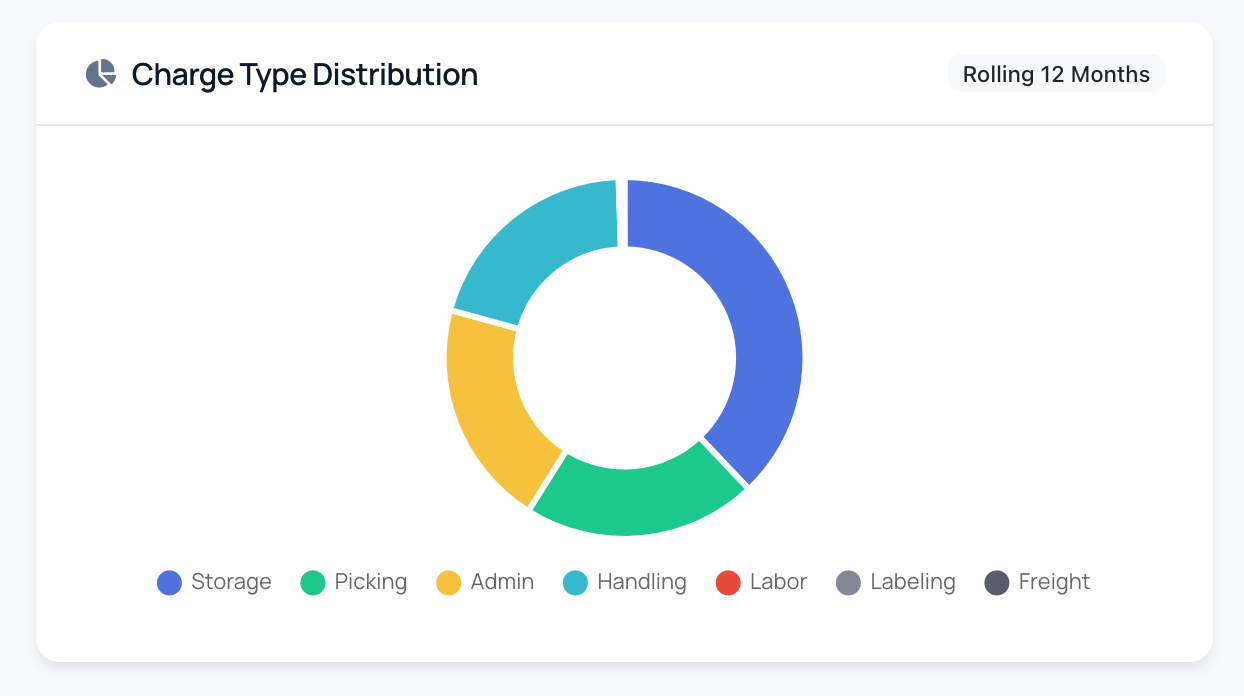
- Get the charge mix out of billing and onto a dashboard.
- Add a picking-cost allocation per client (line items × cost-per-line).
- Add a storage carrying-cost allocation per client (pallets × industry carrying-cost percentage).
- Look at the resulting per-client gross margin and see how it ranks.
The first time most operators do this, the rank order is uncomfortable. The clients you've been treating as crown jewels turn out to be subsidised by the clients you've been treating as second-tier. That's not a failure — it's a piece of information you can act on at the next renewal cycle.
The list of top 10 clients by profit is almost always different from the list of top 10 by revenue. The operators who know which is which are running a different kind of business than the operators who don't.
If you'd like to see this view for your own clients, see how it works or email us and we'll talk through onboarding.
Sources
- Capstone Partners, "3PL Market Update," January 2025.
- Speed Commerce, "How Do 3PLs Make Money? Inside Their Business Model," 2025.
- Extensiv, "4th Annual 3PL Warehouse Benchmark Report," 2023.
- Datex Corporation, "3PL Cost Analysis," October 2025.
- Advantive, "How 3PL Warehouses Can Calculate Customer Profitability," 2024.
- Netstock, "Benchmark Inventory Turnover by Industry," 2024.
- NetSuite, "Obsolete Inventory."
- Linnworks, "How to Increase Your 3PL Business Profitability."